

Industries
Alarm volume grew. The operations centre did not.
Every operator has more events than people and more runbooks than anyone has read. We put agents on the triage, the correlation and the write-up, and leave the judgement calls where they belong.
Triage · Correlation · Diagnosis · Assurance · Post-incident
01 — Where the time goes
The runbook exists. Finding it is the incident.
So is writing up what happened afterwards.
Network operations work is bimodal: long stretches of repetitive triage, then an incident where everything depends on how fast the right context arrives. Both halves are automatable, and neither is automated by a chatbot bolted onto a ticketing tool.
We ground agents in the network inventory, the alarm history and the runbooks, so a ticket arrives already correlated, already matched to prior occurrences and already carrying the customer impact. The post-incident record — the part that always slips — is drafted from the timeline rather than from memory.
Anything an agent executes is a pre-approved runbook action inside a policy engine you control. The list of what it may do is a document your operations team owns, not a setting inside a model.
Talk to Zealogics02 — What you get back
The context arrives with the ticket, not after it.
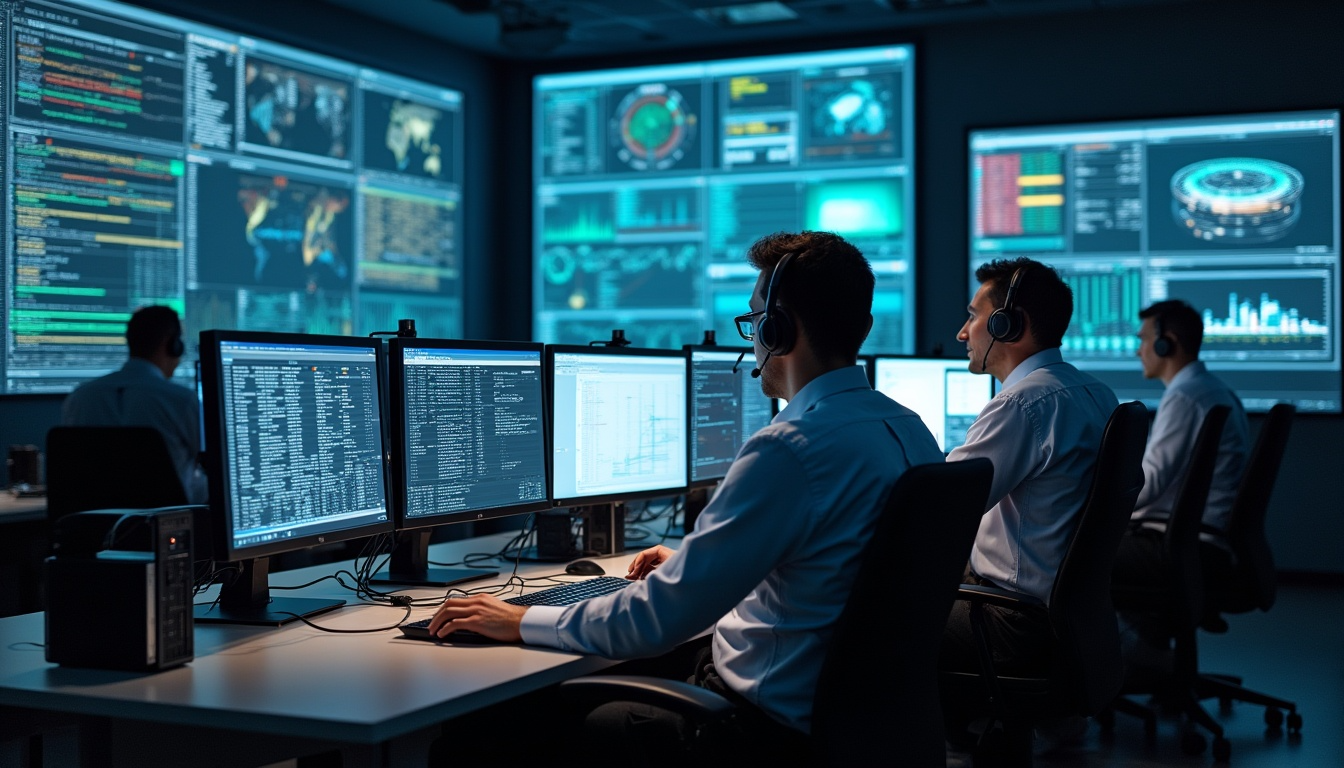
ALARMS, INVENTORY, HISTORY AND IMPACT — CORRELATED.
03 — What the work covers
Where we work in telecom.
Where this shows up
Network and service operations centres
Field and access network operations
Service assurance and quality functions
Change, capacity and planning teams
Enterprise and wholesale service desks
Typical stack
Incident triage and correlation
Alarms grouped by probable common cause across inventory and topology, matched against prior incidents, and summarised with the affected services named rather than the elements.
Diagnosis and guided remediation
Runbook retrieval against the live symptom set, diagnostic steps executed inside policy, and remediation proposed with the blast radius stated before anyone approves it.
Service assurance analytics
Service-level behaviour analysed against network events and customer reports, so degradation is visible before the contact centre becomes the monitoring system.
Change, capacity and post-incident
Change request drafting with impact assessed, capacity trends against actual traffic, and the post-incident record authored from the event timeline.
04 — What ships with it
What a telecom engagement leaves behind.
A demonstration is not a deliverable. These are the artefacts an engagement leaves with your team — owned by you, runnable without us, and auditable by whoever has to sign for them.
01
Correlated event handling
Grouping that reflects your topology and your history, measured on the reduction in tickets that describe the same fault.
02
Runbook retrieval
The procedure that matches the live symptoms, answering with the document rather than a paraphrase of it.
03
The action policy
What an agent may execute, under which conditions, with which approval — written down and enforced outside the model.
04
Impact-first summaries
Tickets and notices that lead with the affected service and customer count, because that is what the next decision needs.
05
Assurance analytics
Degradation signals correlated across network events and customer contacts, surfaced before the contact volume does.
06
Generated post-incident records
Drafted from the timeline within the hour, so the review argues about the cause instead of about the chronology.
05 — Agentic AI, in this sector
Agentic AI in network operations.
Where agents start
- —Ticket summarisation
- —Runbook lookup assistant
- —Change request drafting
- —Customer impact notices
- —Alarm correlation summaries
- —Service report generation
Where they go next
- —Network incident response crew
- —Automated diagnosis and remediation
- —Service assurance analytics
- —Capacity planning agents
- —Post-incident record authoring
- —Churn signal investigation
Safety — Agents execute only pre-approved runbook actions, inside a policy engine your operations team owns and can change without us.
06 — In your words
What clients say before they call us.
“One fault raises forty tickets and we work all forty.”
Event correlation
“The runbook exists. Nobody can find it at three in the morning.”
Runbook retrieval
“Post-incident reviews are written from memory a week later.”
Generated incident records
07 — The rest of the map
Eleven more sectors we work in.
A problem is rarely unique to its industry. Most of what we build here has been built next door as well, which is usually why it arrives faster the second time.
Fab
Semiconductor
Yield investigations, equipment data engineering and the tool intelligence that shortens a root-cause cycle.
Explore
Plant
Manufacturing
Shop-floor copilots, predictive maintenance and the plant reporting that currently happens in a spreadsheet at six in the morning.
Explore
Heavy
Steel
Process optimisation, quality prediction and the reporting heavy industry still assembles by hand.
Explore
Assets
Energy & utilities
Asset performance, inspection data and the field workflows that still move on paper between three systems.
Explore
TIC
Testing, inspection & certification
Digitised inspection, generated reports and compliance search across standards that change under you.
Explore
Finance
Financial services
Reconciliation, close, risk narrative and reporting automation with an approval gate on everything that moves a number.
Explore
Assurance
Audit & assurance
Evidence review copilots, parallel testing agents and document analysis that cites the page it read.
Explore
Clinical
Healthcare
Documentation support, coding assistance and operational insight, with every clinical output approved by a person.
Explore
Public
Government
Citizen services, records intelligence and deployment models that stay inside the boundary the mandate requires.
Explore
Controlled
Defense
Engineering support and controlled AI environments — local models, no external calls, clearance-aware retrieval.
Explore
Talent
Staffing
Engineering, IT and AI talent for Fortune 500 programmes across the USA, UAE, Taiwan and India.
Explore
Have a problem worth solving?
Give us a month of alarms.
Correlation against your own event history is the quickest way to see how much of the current ticket volume is one fault wearing many hats.